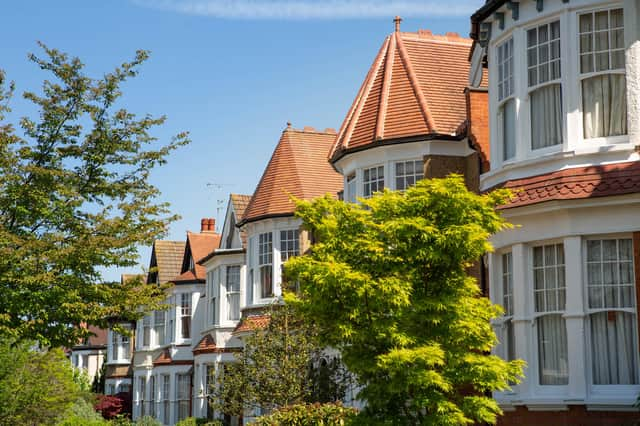
Many areas around the UK saw dramatic increases, with the pandemic seeing people buy homes, and property value soaring.
Here are the 10 councils in England that have seen the biggest house price increases, according to data from the Government’s UK House Price Index.
. shutterstock_1710297793.jpg
Many areas around the UK saw dramatic increases, with the pandemic seeing people buy homes, and property value soaring (Photo: Shutterstock) Photo: Shutterstock
. Kensington and Chelsea
Kensington and Chelsea recorded the biggest increase in house prices with a 28.6 per cent annual change. In November 2019 the average price was £1,171,530, in November 2020 it was £1,507,130 Photo: Shutterstock
. Brent
The London Borough of Brent recorded the second biggest increase with an annual change of 23.9 per cent. In November 2019 the average price was £435,981, in November 2020 it was £540,086 Photo: Shutterstock
. City of London
The City of London was third on the list, recording an annual change of 18.6 per cent. In November 2019 the average house price was £772,325, in November 2020 it was £916,239. Photo: Shutterstock
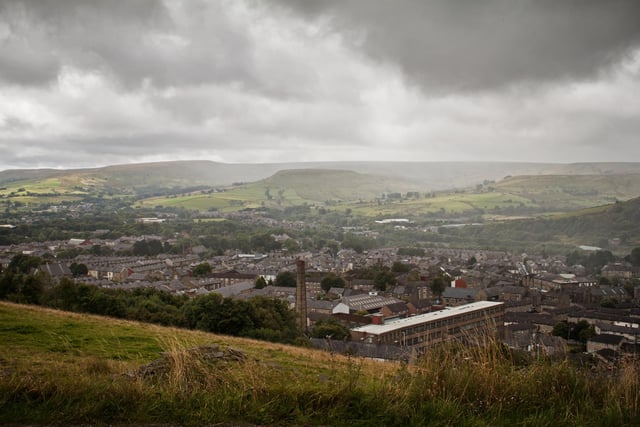
9. Rossendale
Rossendale Council in Lancashire recorded an annual change of 13.3 per cent. In November 2019 the average price was £142,502, in November 2020 it was £161,441. Photo: Shutterstock
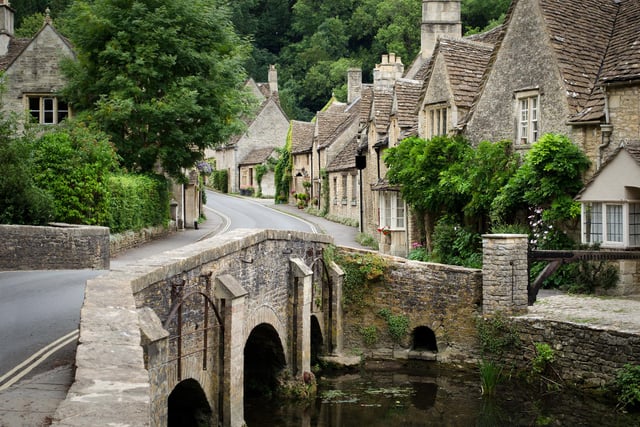
10. Cotswold
Cotswold in East Gloucestershire recorded an annual change of 12.8 per cent. In November 2019 the average price was £383,220, in November 2020 it was £432,348. Photo: Shutterstock